Attention: World-2DPAGE is no longer maintained.
How to interpret a 2D PAGE map
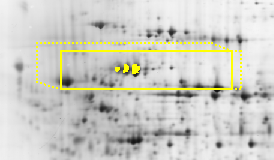
A 2D PAGE map is shown on your screen as a GIF file. One or more area on the map should contain a yellow drawing like the one shown here:

This example shows a small part of the human liver map. The spots highlighted in yellow are the proteins identified in SWISS-2DPAGE (in this case it's the human HSPD1). The plain yellow lines show a rectangle box around the pI and Mw values computed from the protein sequence. This is the region where one would expect to see the protein on the gel. The dashed box on the right (or left in certain cases) represents the region extension, if the protein may be acetylated or phosphorylated. In case of a glycosylated protein, a dashed region is drawn above and on the left of the main region, extending also the region in which to search for the given protein.
If the protein has not (yet) been identified in SWISS-2DPAGE for the given map, then only the yellow boxes will be drawn, showing the region in which one might find the protein spots.
Warning: the displayed region reflects an area around the theoretical pI and molecular weight of the protein and is only provided for the users information. It should be used with caution, as the experimental and theoretical positions of a protein may differ significantly.
If you need more information...